How do all those bingles add up?
For your fleetSG Fleet partners DingGo have been working on a major update to their fleet reporting dashboard that will give customers better visibility into the trends, benchmarks and costs of their accident repairs across fleets of vehicles. This forms part of DingGo’s ongoing mission to make accident repairs faster, more efficient and more transparent.
In running through this new functionality, DingGo shared some of the data collected from the claims histories of their Australian customers over the past 18 months (January 2023 through to July 2024).
The analysis looked at five areas:
- Repair costs
- Total accident costs
- Insurance costs
- Incident numbers by industry
- Repair efficiency
- Driving conditions
In many instances, the data revealed what we may have anecdotally suspected while clarifying the finer details, but there were some surprises too.
Here’s a snapshot of the big takeaways:
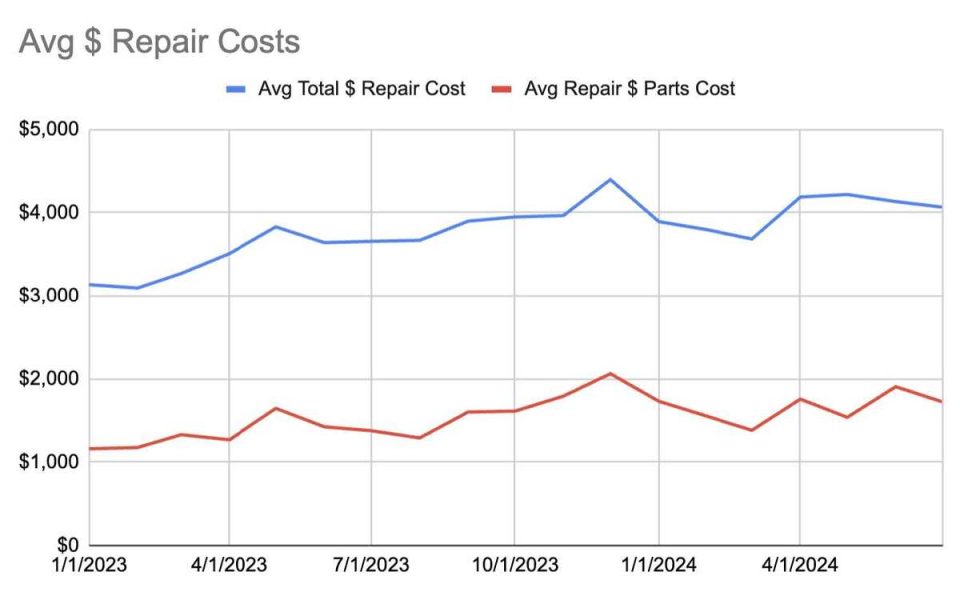
Repairs costs
With costs rising across the board internationally, not just in the motor vehicle industry, it’s hardly surprising that repair costs are reflecting this trend.
The average total repair cost for fleet vehicles has risen from an average of $3,100 in January 2023 to $4,000 per repair in July 2024 (more than 30%). The average cost of parts for repairs — which makes up approximately 50% of a repair bill — have grown from $1,100 in January 2023 to $1,700 in July 2024 (around 55%). So, $600 of the $900 increase in average repair price is coming from parts price increases.
These numbers suggest that those responsible for business vehicles need to pay extra attention to the handling of their fleet repairs to ensure their accident repair costs budgets don’t skyrocket.
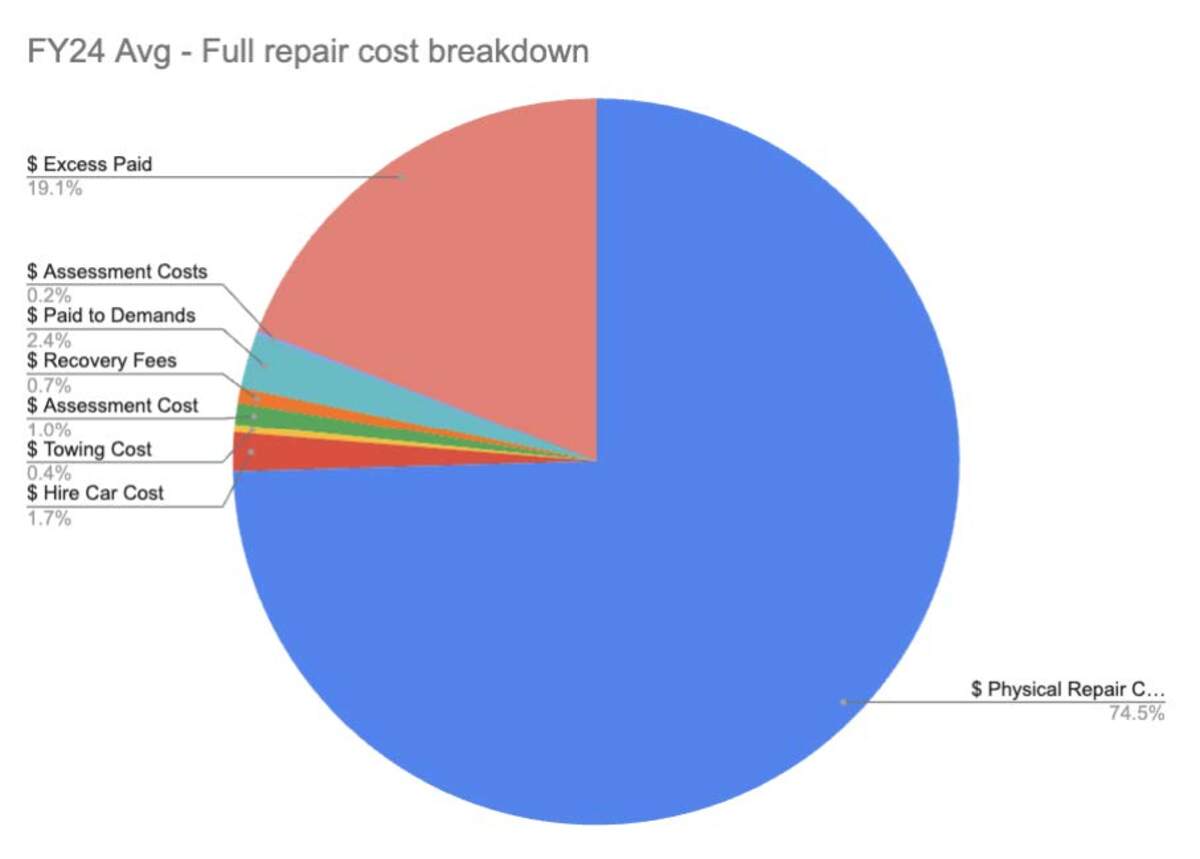
Total accident costs
It’s important to remember the cost of an accident isn’t isolated to simply fixing body damage; there is a range of costs involved in getting vehicles back on the road after a collision.
While repair costs make up around 75% of a repair bill, the numbers indicate insurance excess payments account for 19% of the full repair cost, with roughly 2% going to additional costs like towing charges and hire car costs. Another 4% goes to covering the cost of assessors and recovery agencies. The amount recovered from third parties has also been dropping as a share of full repair costs.
This serves as a timely reminder of how incidental items can contribute to the total cost of accidents, and that they must not be forgotten in the greater scheme of your budget planning. Furthermore, the importance of capturing third party data at time of incident to ensure the best chance of effective recovery should also be emphasised.
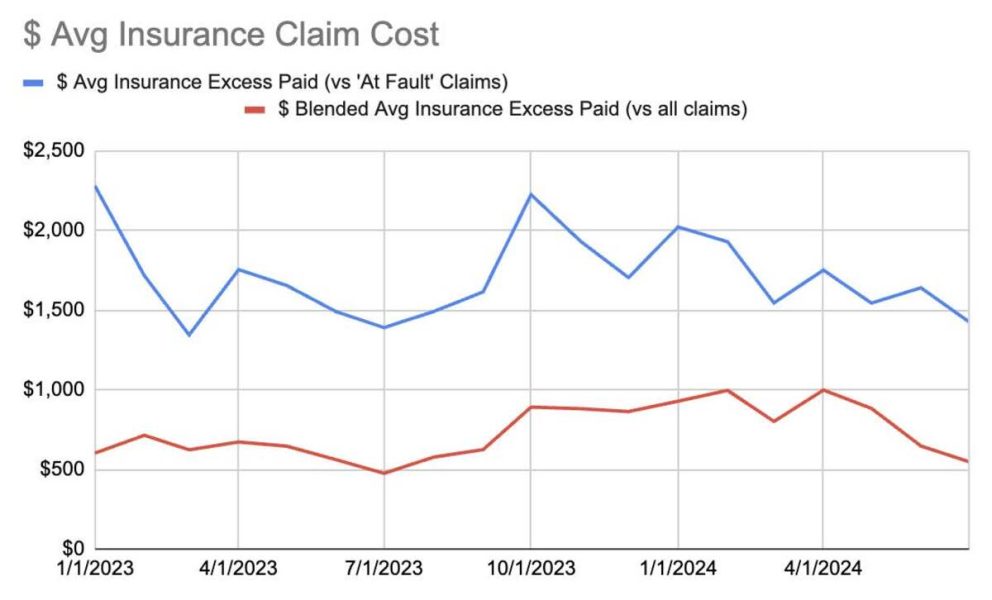
Insurance costs
Insurance cost trends have largely mirrored repair costs, with insurers seeing an increase in the cost of repairing a vehicle rise by around 30% from January 2023 to July 2024. Blended total claim costs have increased due to higher rate of ‘at fault’ claims (so less of total cost is recouped through recovered funds).
Once again, this will impact on your budgetary bottomline as these rising costs will inevitably end up being passed through to you with rising insurance premiums at renewal.
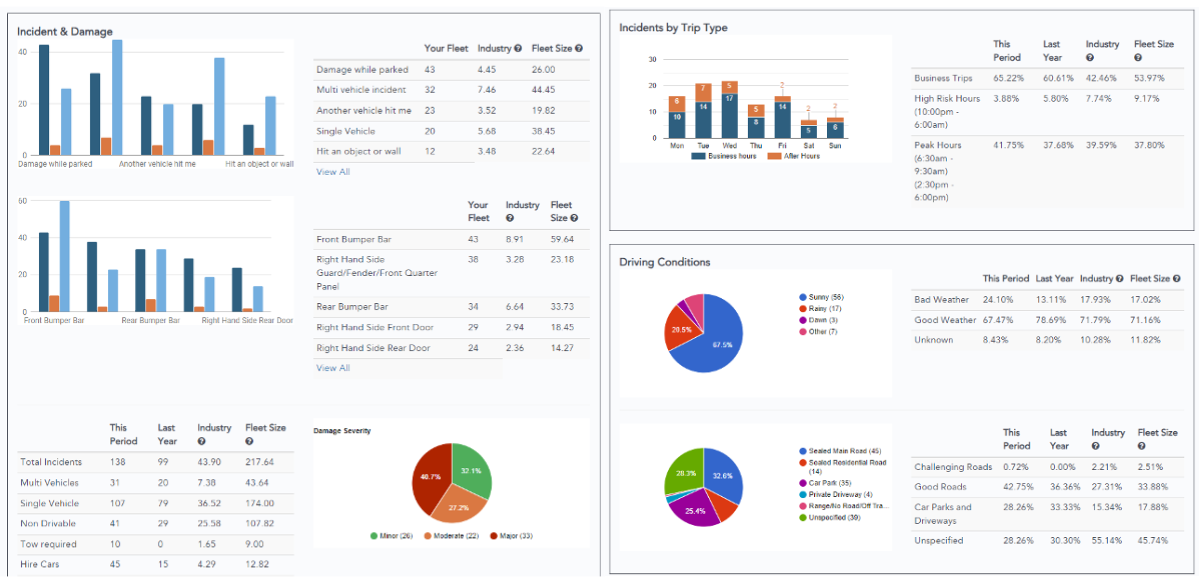
Incident numbers by industry
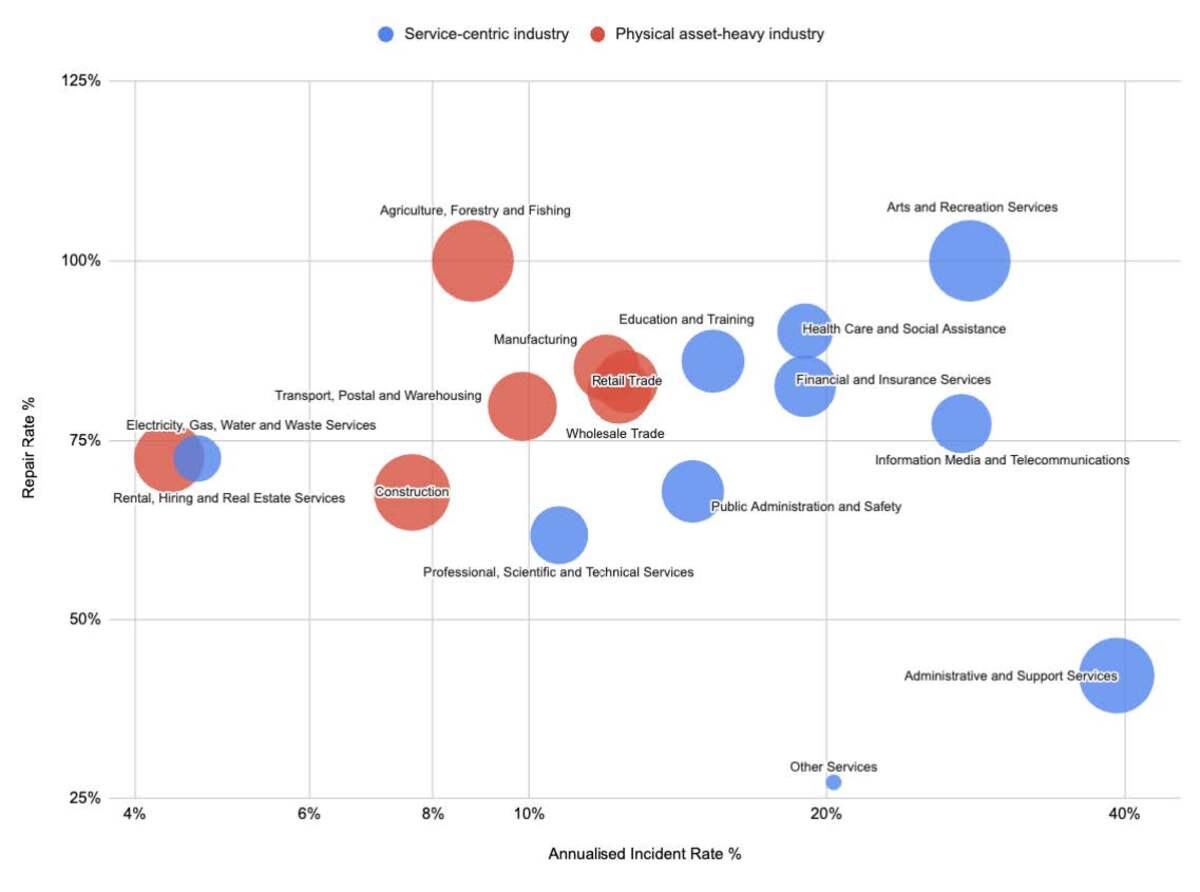
Arguably one of the most interesting statistics concern incident rates, as categorised by industry, from January 2023 to July 2024.
According to DingGo’s data, fleets in service-centric industries – such as information media, telecommunications, financial services and healthcare, for example – tend to have a higher incident rate than those in physical, asset-heavy industries like construction and utilities.
That being said, the average repair costs for fleets operating in physical asset-heavy industries are higher than for those in services-centric industries. The agriculture, forestry and fishing sector topped the list of average repair costs by industry at $6,500.
At the opposite end of the spectrum, rental, hiring and real estate services performed best with average repair costs for that industry coming in at $2,900.
Outside of the industry sector, it is clear there are two distinct trends jn fleet repair: whether a fleet is service-centric or physical asset-heavy. These translate as higher incident and repair rates with lower average repair costs for service-centric industries, while there are low incident and repair rates with much higher repair costs for physical asset-heavy industries.
If your business falls into either one of these categories, it’s worthwhile comparing your fleet insights and reviewing your incident rate, repair rate and average cost of repair to see how well your drivers and fleet are performing for both your industry sector and service/physical-asset heavy trends.
Repair efficiency
After blowing out across the last 18 months, the data shows that fleet vehicles are now spending less time in the workshop after a collision, with panel beaters improving both their remote quoting and onsite quoting speeds. While repair times increased in the second half of 2023, due to the lasting delayed impact of COVID backlogs, 2024 has witnessed a return ‘back to normal’, with the October 2023 high of 13.5 days falling to 8.6 as of July 2024.
This is good news for the likes of DingGo whose service is centred on making improvements in repairs efficiency, which has notoriously been a bone of contention for fleet operators in the past.
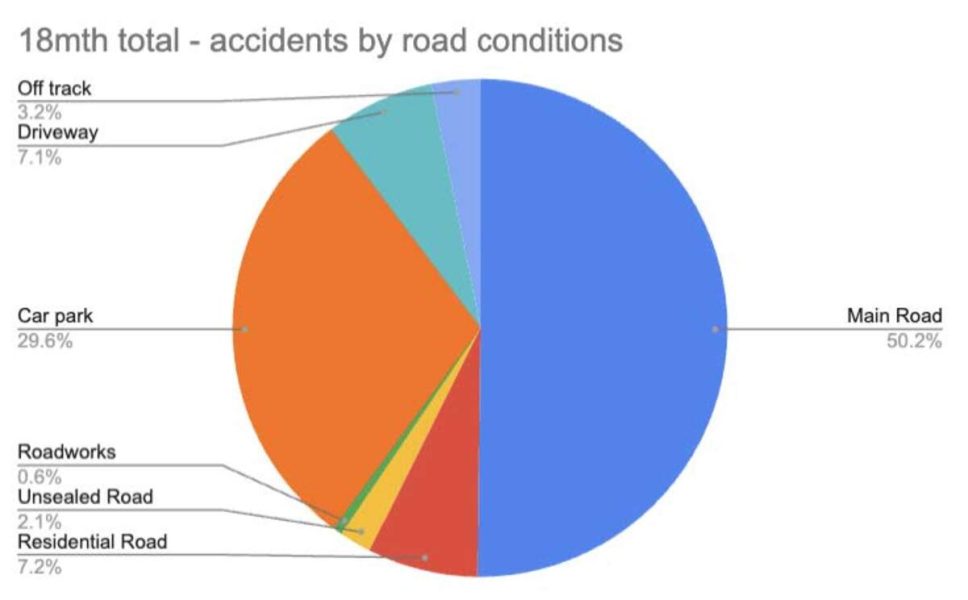
Driving conditions
Another interesting set of metrics is the breakdown of road conditions where incidents are most commonly occurring. The numbers show that, across the last 18 months, 50% of all accidents occurred on a main road, while 30% took place in a car park.
Despite dropping to 43% in January 2024, main road accidents have risen steadily across 2024 to a high of 56.5% in July. Carpark incidents have fallen from a high of 33% in January 2024 to a low of 24.8% – the lowest figure from January 2023 to July 2024. Incidents on unsealed roads have risen from 0.7% in January 2023 to a high of 3.1% in July 2024.
While it’s not surprising that main roads are where most incidents occur, this rise in numbers means we still need to prioritise road and driver safety, in the workforce and after-hours, as we move forward. Elements such as driver distraction, wildlife and even the vehicles themselves can contribute to escalating road accidents and fatalities.
In conclusion
Insights like these provided by DingGo demonstrate how a detailed analysis of vehicle accident data can transform fleet management.
By offering a deeper understanding of your fleet data––in comparison to other fleets in your sector or other fleets of your size, repair trends, industry-specific risks and accident patterns––those responsible for the financial, HSE and operational management of your business and transport fleets can reduce costs, increase safety and get more out of their vehicles.
Speak to SG Fleet today about better fleet accident management.